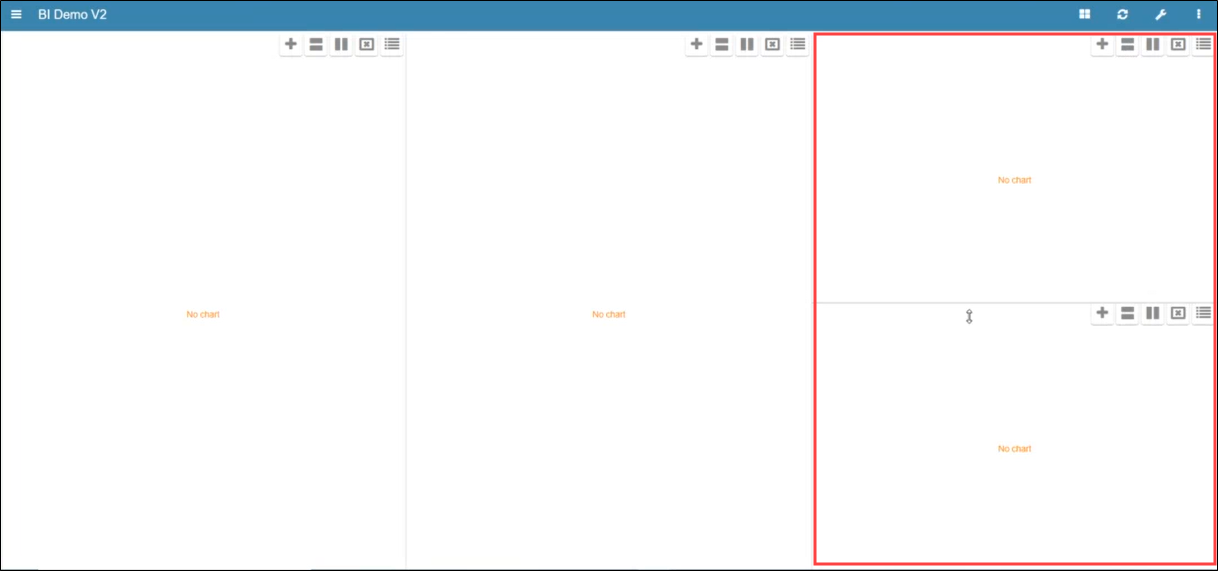
A chart dashboard can host multiple charts.
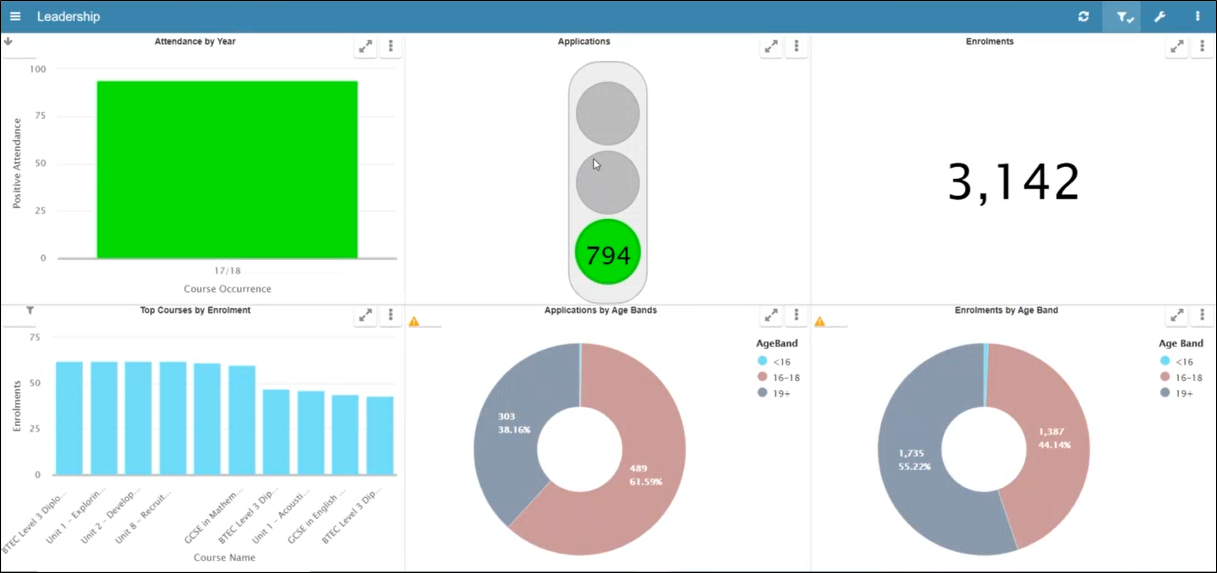
The chart ribbon hosts the chart function buttons.
These buttons are described in the following table.
| Button | Button name | Does this... |
|---|---|---|

|
Notifications | Displays the notification screen. |

|
Full Screen | Expands the dimensions of the chart display to full screen. |

|
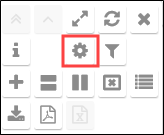
Chart tools | Expands the right sidebar menu, displaying further buttons. |
The Chart Tools button reveals further buttons, described in the following table.
| Button | Button name | Does this... |
|---|---|---|

|
Back to top | Drill to the top of the chart. |

|
Up one level | Drill up one level of a chart. |

|
Full screen | Expands the dimensions of the chart display to full screen. |

|
Refresh chart | Refreshes the data displayed in the chart. |

|
Close | Closes the chart tools menu. |

|
Chart information | Displays information about the chart. |

|
Edit chart | Displays the chart screen. |

|
Edit chart temporary filters | Displays the edit filters window. |

|
Create new chart | Adds a new chart to the dashboard. |

|
Split top and bottom | Splits the dashboard horizontally, adding a row style to the display. |

|
Split left and right | Splits the dashboard vertically, adding a column style to the display. |

|
Remove cell | Removes the chart cell from the display. |

|
Replace chart from library | Displays a list of available charts that can replace the current selection. |

|
Download data | Downloads chart data to CSV. |

|
Export to PDF | Downloads chart data to PDF. |

|
Export to Excel | Downloads chart data to Excel. |
Dashboards can be adjusted to host multiple charts, which can be edited to change the output colours and the display format and so on.
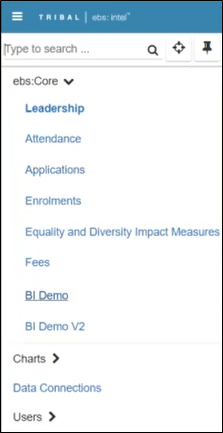
To open a chart dashboard:
-
Select the Menu button from the dashboard ribbon.

The left-hand sidebar menu is displayed.
-
Select the relevant category.
The relevant dashboard is displayed.
-
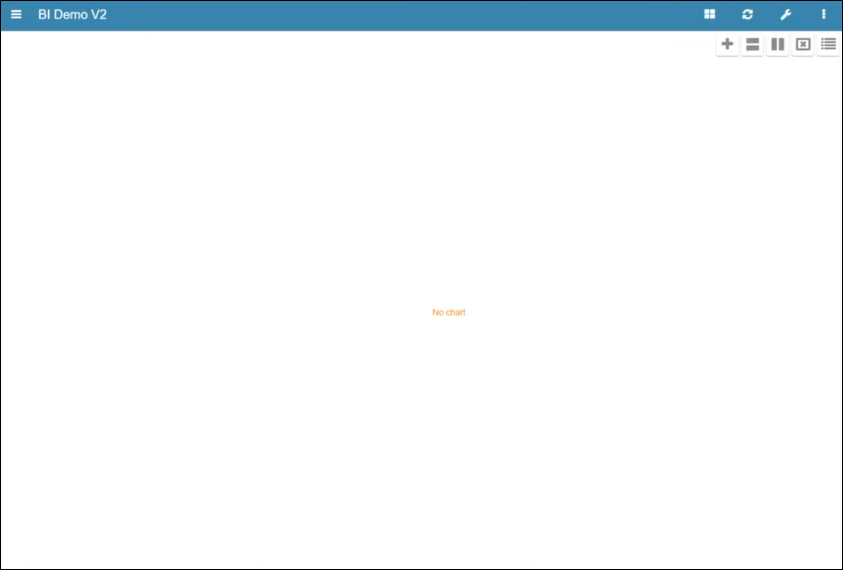
The chart ribbon contains the following function buttons.
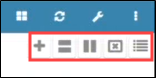
These buttons are described in the following table.
| Button | Button name | Does this... |
|---|---|---|

|
Create a new chart | Adds a new chart to the dashboard. |

|
Split top and bottom | Splits the dashboard horizontally, adding a row style to the display. |

|
Split left and right | Splits the dashboard vertically, adding a column style to the display. |

|
Remove cell | Removes the chart cell from the display. |

|
Replace chart from library | Displays a list of available charts that can replace the current selection. |
To customise a chart dashboard:
-
Select the relevant chart dashboard.
The relevant dashboard is displayed.
-
You can adjust your display to use rows and columns to host charts.
Use the Split left and right button to add columns.
Columns are added.
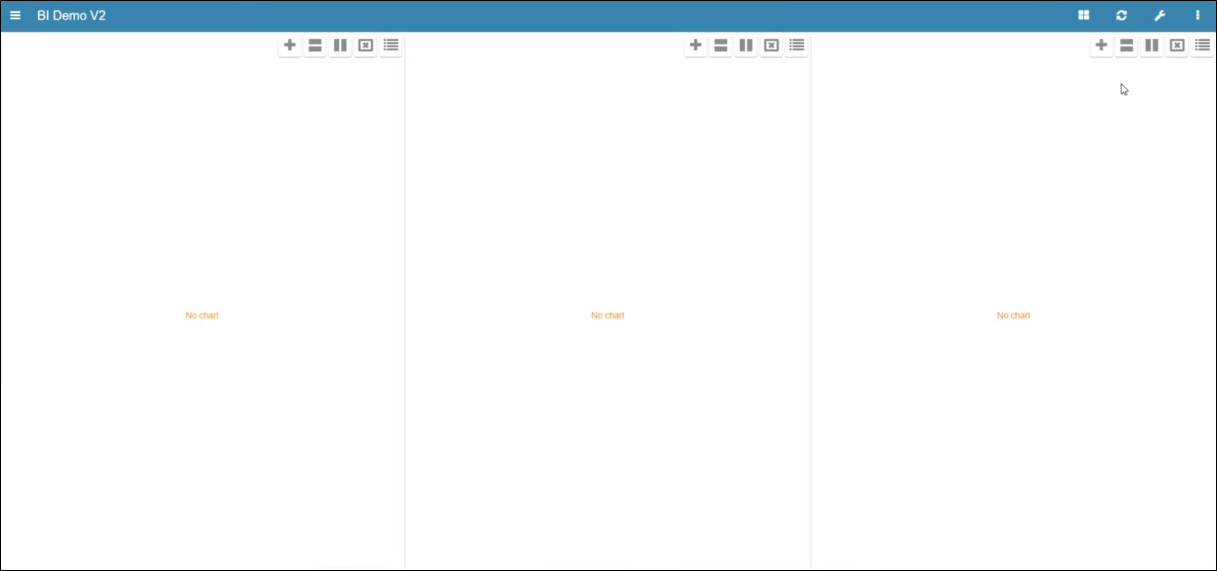
Use the Split top and bottom button to add rows.
Rows are added.
- Select Save .
To add a new chart:
-
Select the Create new chart button.
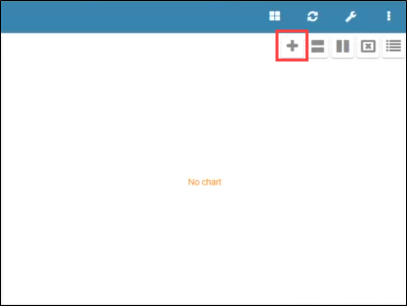
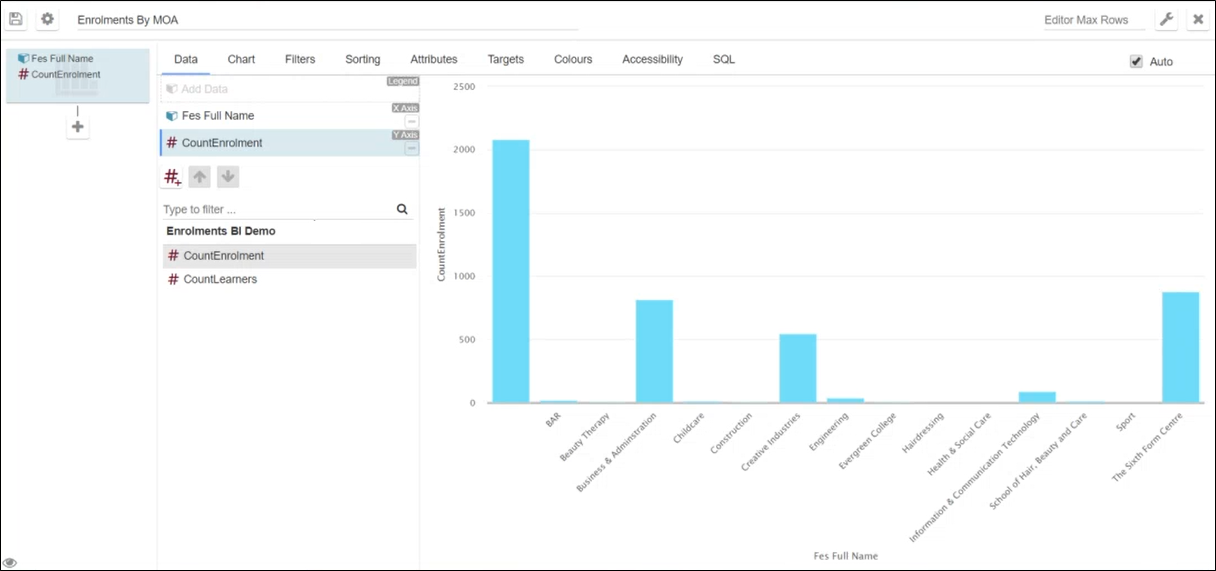
The chart screen is displayed.
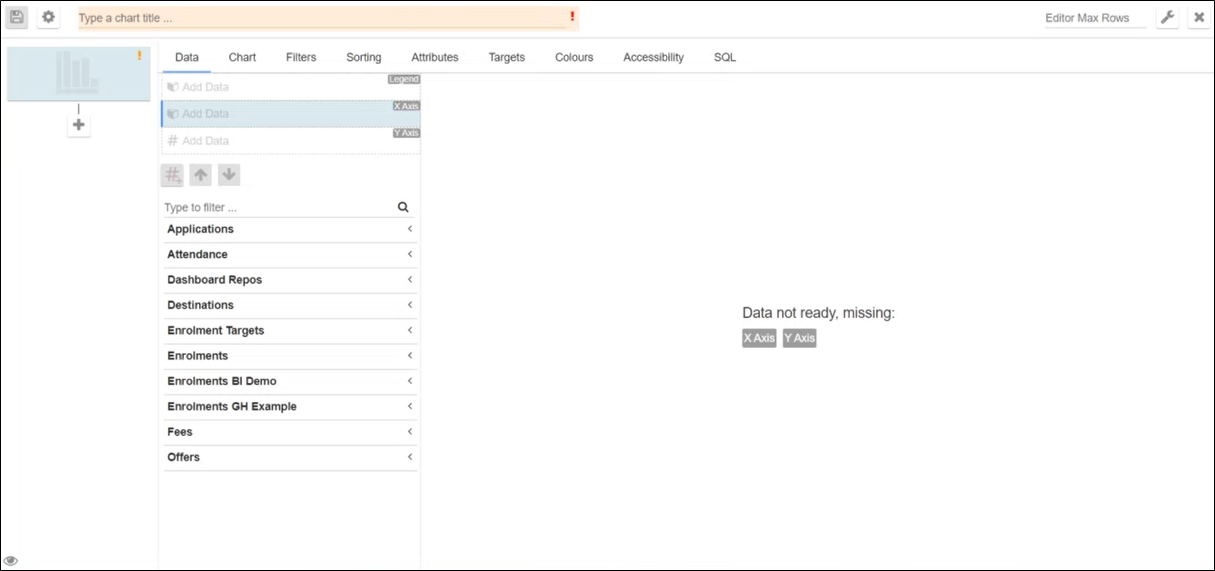
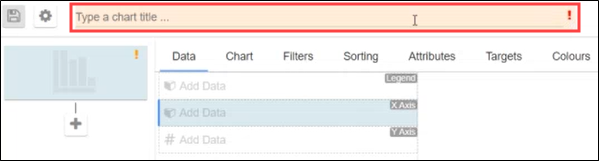
-
Add a title to your chart.
-
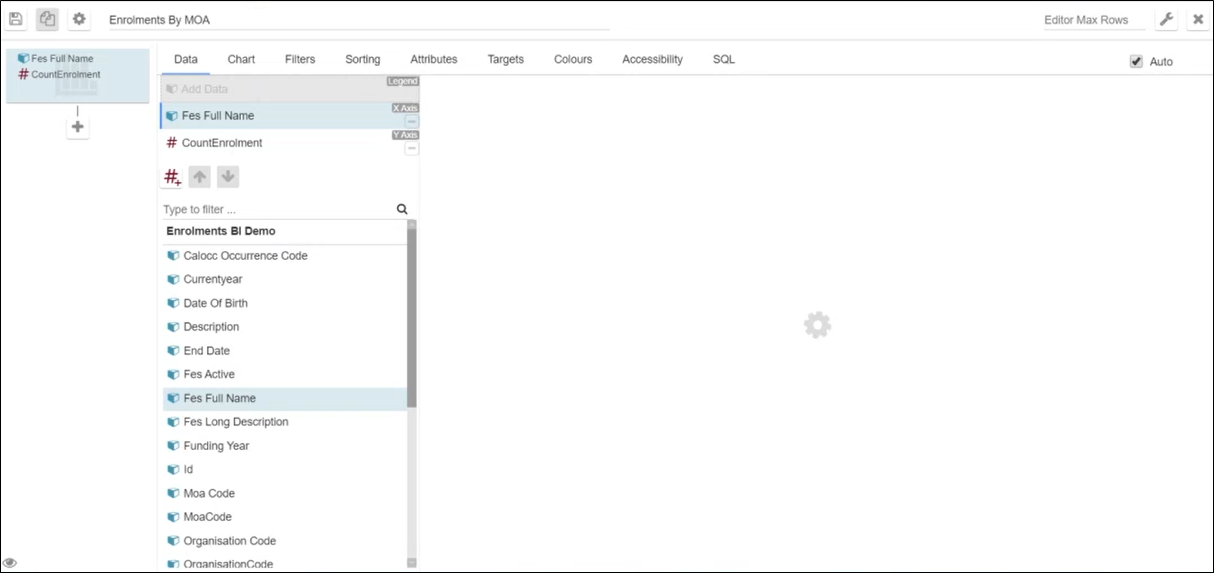
Select the Data tab followed by the relevant data connection.
The available columns are displayed.
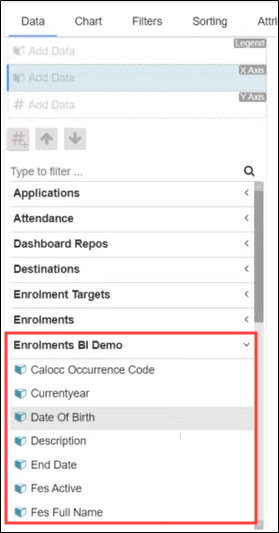
-
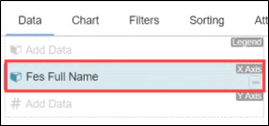
Select a column.
The column is added to the X Axis field.
-
Select theY Axis field.
The available filters are displayed.
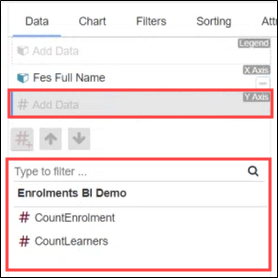
-
Select the relevant filter.
The filter is added to theX Axis .
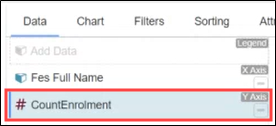
The data based on the X and Y axis entries is displayed.
- Select Save .
To sort the data contained in an existing chart:
-
Select the Chart tools button.
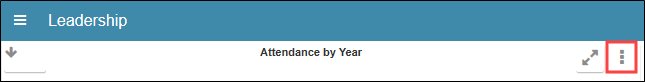
The Chart Tools ribbon is displayed. Select the Edit Chart button.
The chart screen is displayed
-
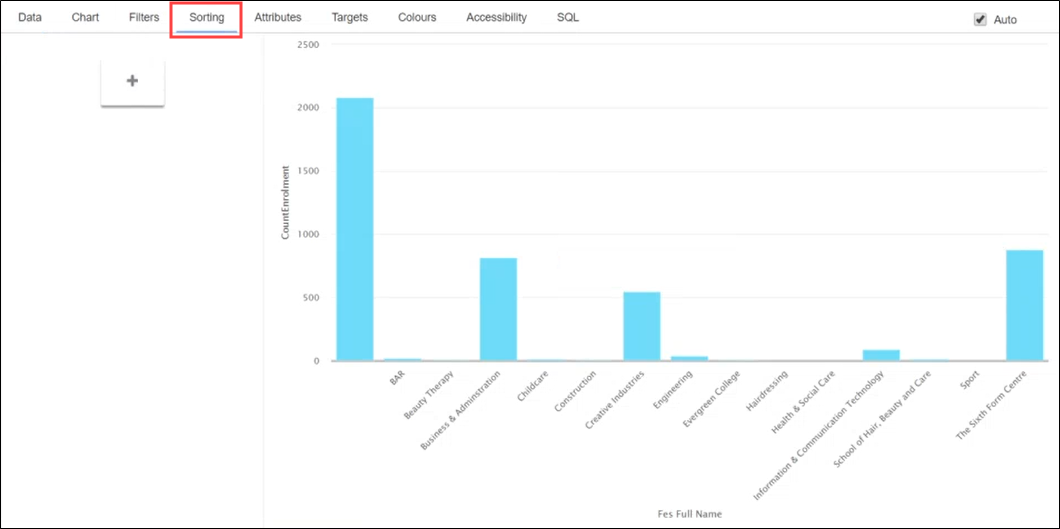
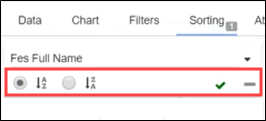
Select the Sorting tab.
The Sorting tab is displayed.
-
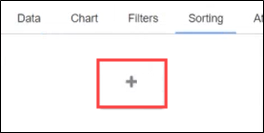
Select the + button.
-
Use the drop-down list at the top of the screen to choose the value to sort, if required.
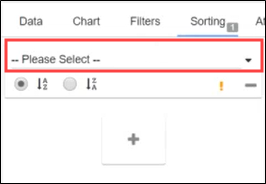
The sort options are displayed.
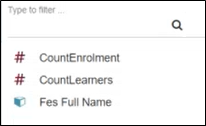
-
Select the sort option.
-
Select the Ascending or Descending radio buttons to adjust the chart.
- Select Save .
To filter the data contained in an existing chart:
-
Select the Chart tools button.
The Chart Tools ribbon is displayed. Select the Edit Chart button.
The chart screen is displayed.
-
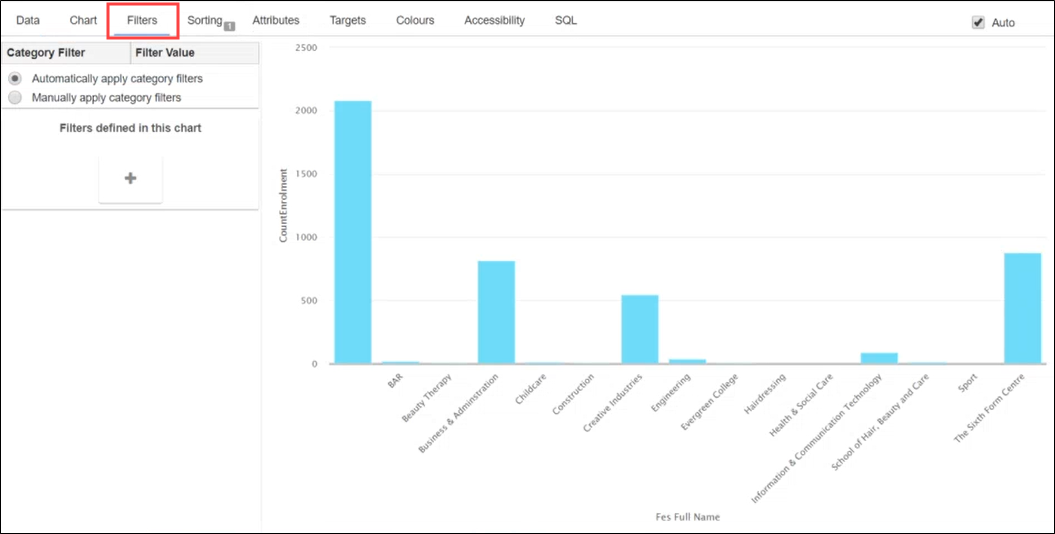
Select the Filters tab.
The Filters tab is displayed.
-
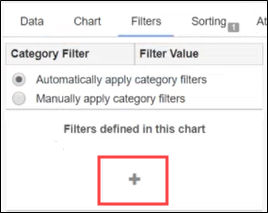
Select the + button.
-
Select the drop-down list to choose the x axis chart data value.
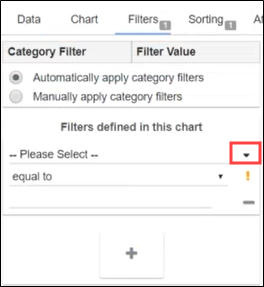
The x axis chart data values are displayed.
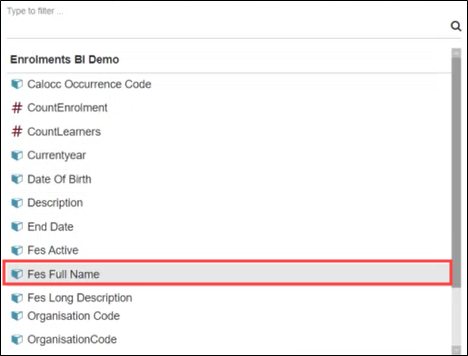
-
Select the relevant value.
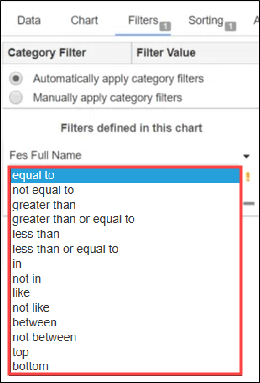
-
Select the relevant operator from the drop-down list (for example: equal to, not equal to, and so on).
-
Select the filter drop-down list to display the relevant values.
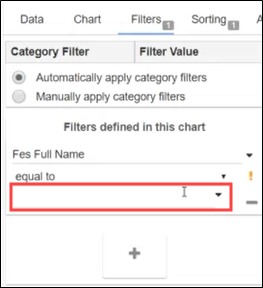
The available values are displayed.
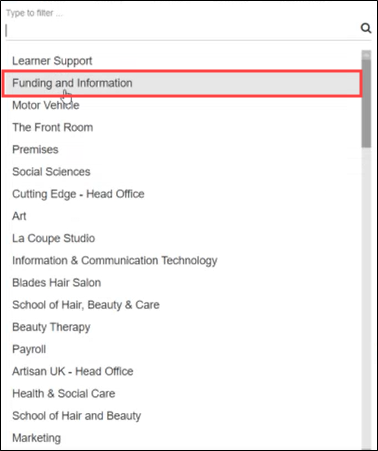
- Select the relevant value.
- Select Save .
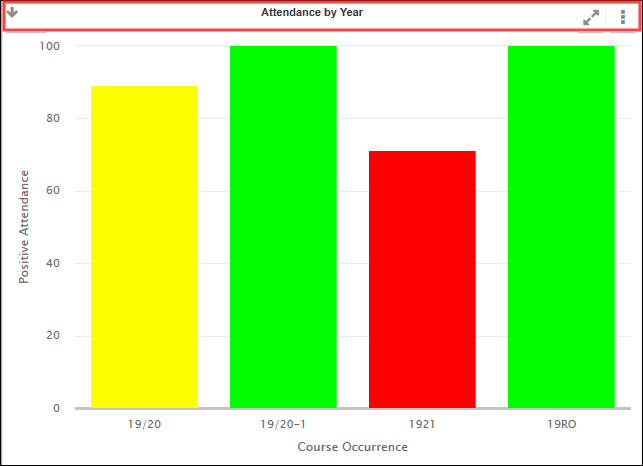
To alter the colours used in an existing chart:
-
Select the Chart tools button.
The Chart Tools ribbon is displayed. Select the Edit Chart button.
The chart screen is displayed.
-
Select the Colours tab.
The Colours tab is displayed.
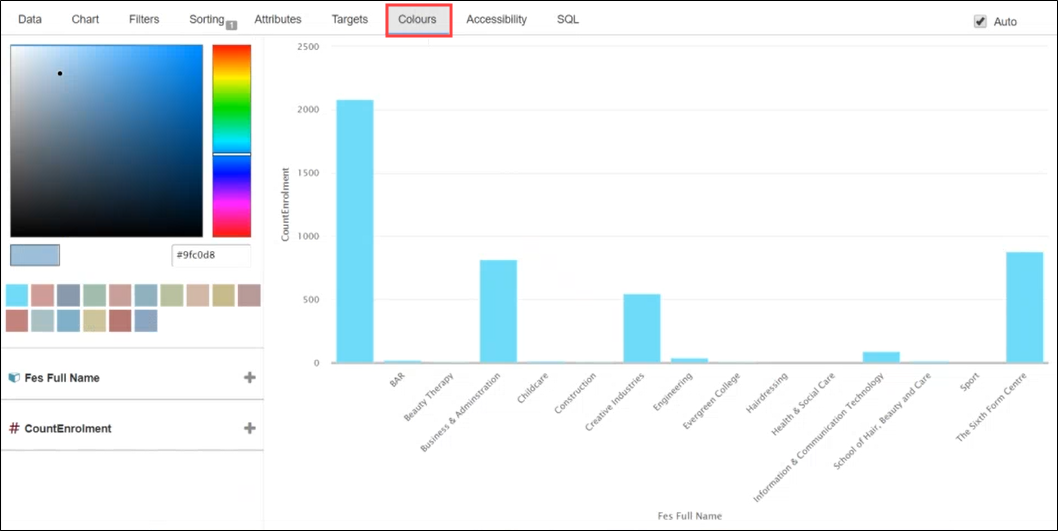
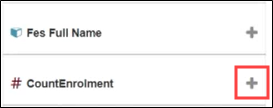
-
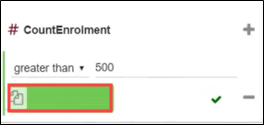
Select the + button to set a colour for the x-axis value.
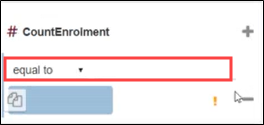
-
Select the relevant operator and enter the relevant value (for example: greater than 500) .
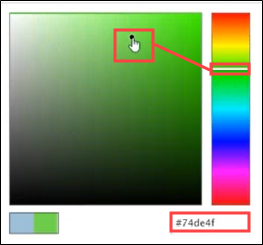
-
Select a colour from the colour picker bar, which can be defined in the colour palette. Alternatively, enter the Hex value.
-
Select the Use colour from the colour palette field to update the colour used.
The chart colours are updated. You can set further colour values by selecting the + button.
- Select Save .
To adjust the chart type displayed in an existing chart:
-
Select the Chart tools button.
The Chart Tools ribbon is displayed. Select the Edit Chart button.
The chart screen is displayed.
-
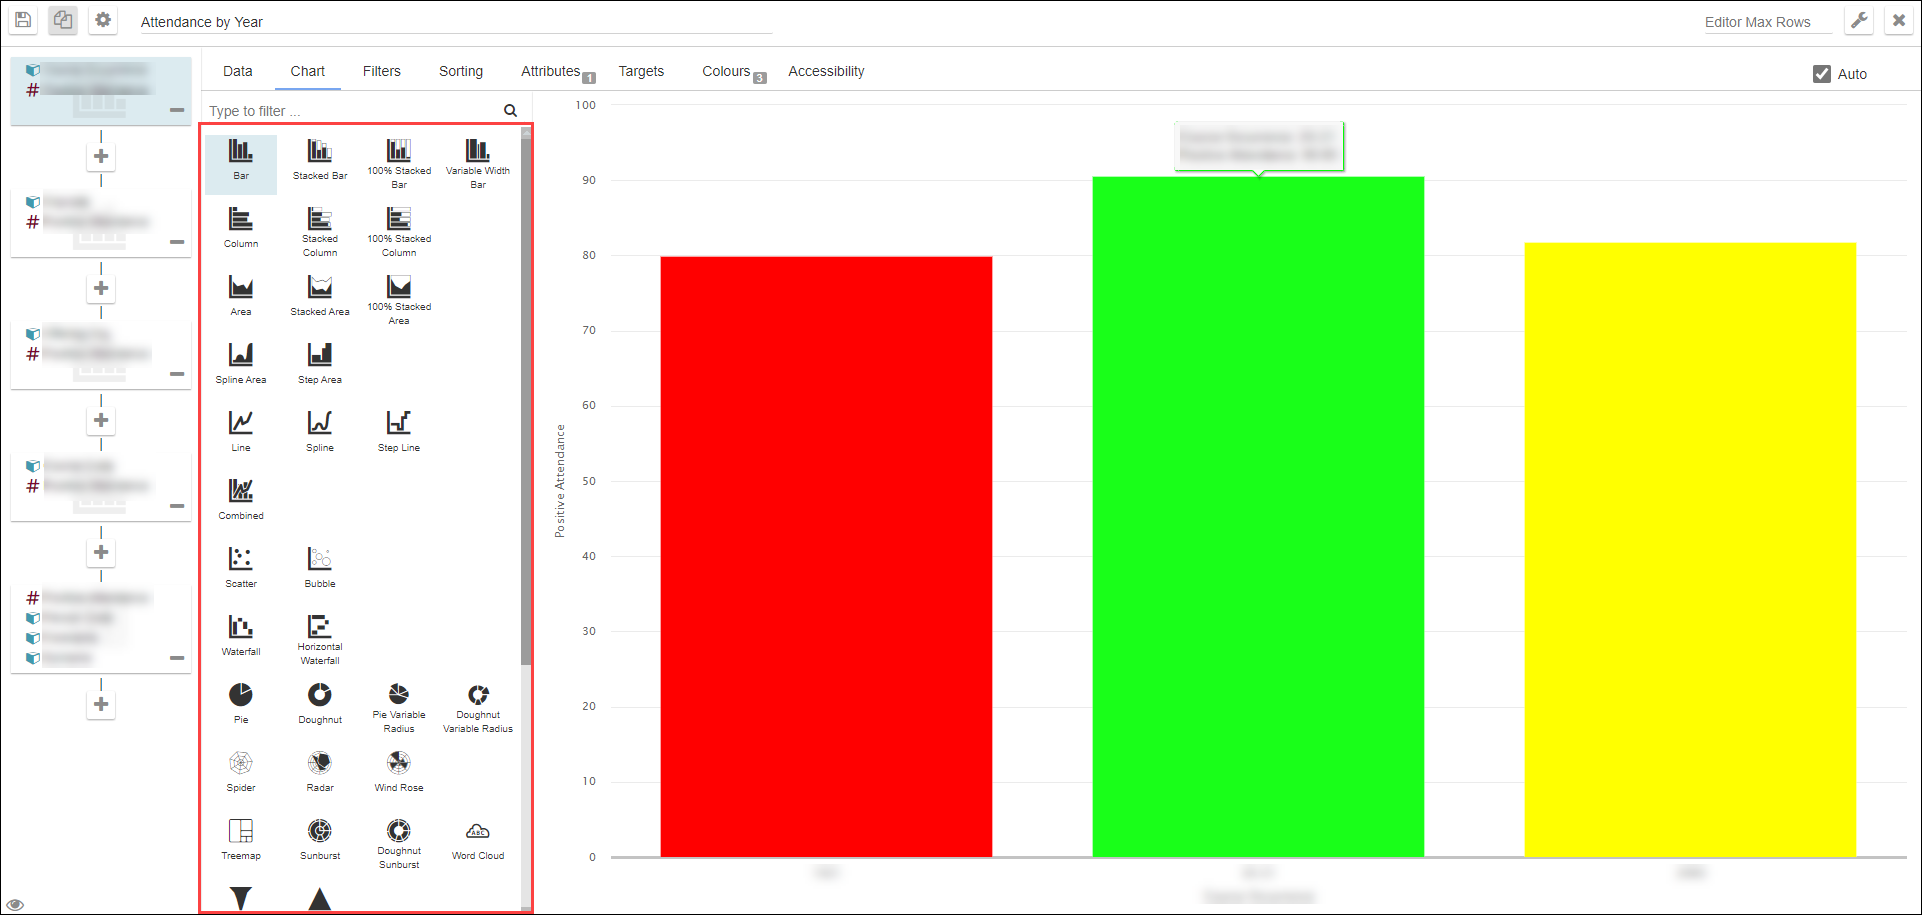
Select the Chart tab.
The Chart tab is displayed.
-
Select the relevant chart type.
-
Select Save .